1. Bank

Bank
| Building Type | Economical |
| Building Site | Created by Developement Counselor |
| City Point | 65 |
| Storage | - |
1.1 Introduction
The Bank is a city building that can only be commissioned by the developement counselor of the city.
The bank provides +0.10 gold/day per active citizen, per level.
1.2. Transfer
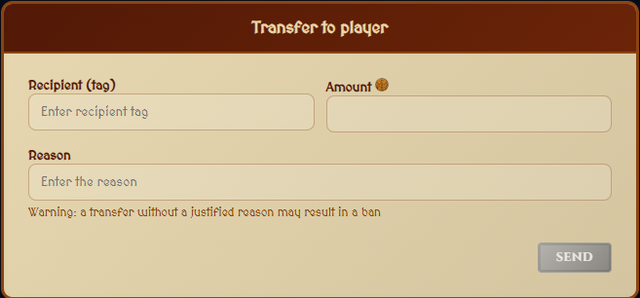
The bank is the only safe and reliable place to transfer money from one person to another.
To make the transfer, simply remember to enter the recipient’s name, the amount, and the reason for the transfer.
1.2. Salary
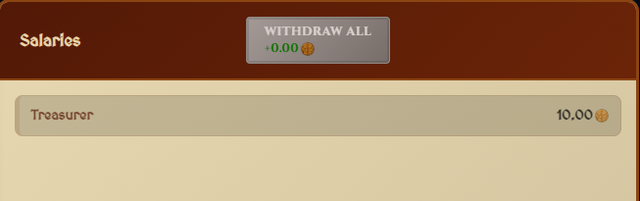
In this building the member of the government of one city can withdraw his salary.
If it is not withdrawn, the salary will not accumulate within the building but will be lost forever.
You are not restricted to withdrawing your salary from the bank in the town where you are a member of the local council; you can also withdraw it from other banks.
Starting at level 1 and onward the bank provides +70 gold/day for government salaries.

1.4. Loan
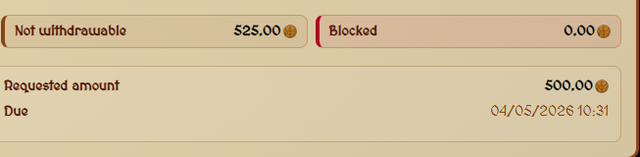
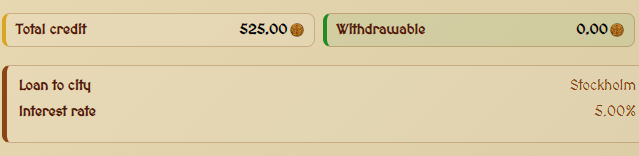
With the end of the construction site of the bank, the Treasurer is enabled the possibility to request a city loan.
Citizens who decide to support the city by funding this loan will receive interest on the loan.
1.4. Statistics
Economic statistics can be categorized as either personal or server-wide and will be displayed for the reference period.
You can choose from 5 reference periods:
- Last 7 days
- Last 30 days
- Last 90 days
- Last year
- All time
1.4.1. Personal
Balance over time
It tracks the history of your account balance.

Inflow and Outflow
A histogram shows the income and expense for the relevant days of the reference period.

Amount distribution
A histogram shows the total value of transactions by range of coins traded.

Income breakdown
A ring chart shows the percentage breakdown of your income.

Expense breakdown
A ring chart shows the percentage breakdown of your expense.

1.4.1. Server
The page opens to show the total number of coins currently in circulation; it then specifies how many of these are in the pockets of the citizens and how many are in the city’s coffers.
You can view the average interest rate on outstanding loans, the index of inequality in wealth distribution (Gini coefficient) and the number of active people.

Citizens vs Treasuries
A pie chart shows how the total amount of coins is divided between citizens and the city coffers.

Loans by status
A pie chart shows the breakdown of the status of the loans.

Wealth per city
A bar chart shows how the quantities of coins are distributed among the various cities.

Wealth distribution
A histogram shows the total value of transactions by range of coins traded.

Transfer volume over time
A line graph shows the total monetary value of transfers between players.

Public salaries paid
A histogram shows the total amount of coins withdrawn as salary for the relevant days of the reference period.

Top debtor cities
The total amount, including outstanding interest, that the cities must repay to citizen is shown.

Comments
Log in to comment.
No comments yet.